HubSpot’s new features are making the reporting and analytics part of your business a lot more intelligent, accurate, and streamlined.
These updates speak to the needs of today’s businesses that rely on this information to drive critical decisions. Case in point, 94% of enterprises believe data and analytics are important for growth and digital transformation.
One of the most notable updates that HubSpot has paid close attention to lies within sales and prospecting. Their tools and features cater to improving your sales engagement and a more efficient way to keep track of that. They’ve also enhanced the way you manage other daily and administrative tasks that might take up your day.
[Quick tip: In case you missed it, we wrote about updates to HubSpot’s Sales Hub. These changes make prospecting much more organized, with robust new features delivered in true HubSpot style in a neat, unified pane.]
So what changes should you expect from HubSpot and how will it upgrade the way you run your reporting and analytics?
Let’s dive in.
The name of the game is selling and revenue, and beyond changes to Sales Hub, HubSpot brings more in-depth reporting and analytics capabilities.
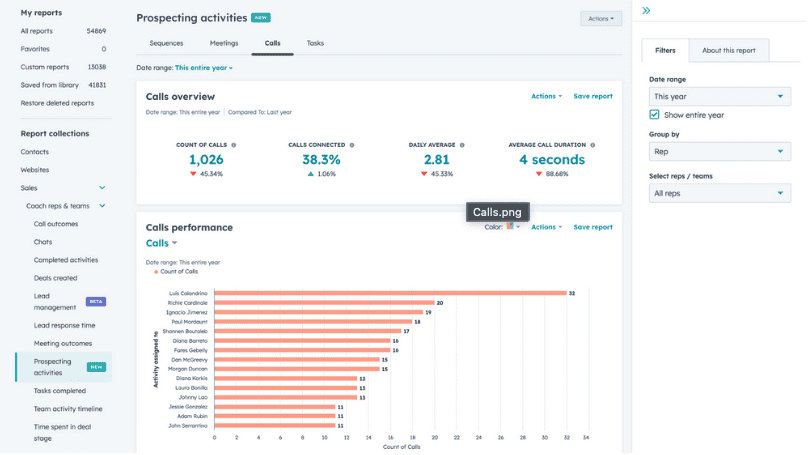
A new tool, Professional+, is meant to help sales managers gain a more comprehensive view of their team’s prospecting activities. It allows them to see and track activities that revolve around engaging prospects, including email sequences, calls, and meetings.

The analytics show KPIs, or key performance indicators, broken down by:
This allows an easy way for managers to see which sales reps are outperforming and who might be falling behind.
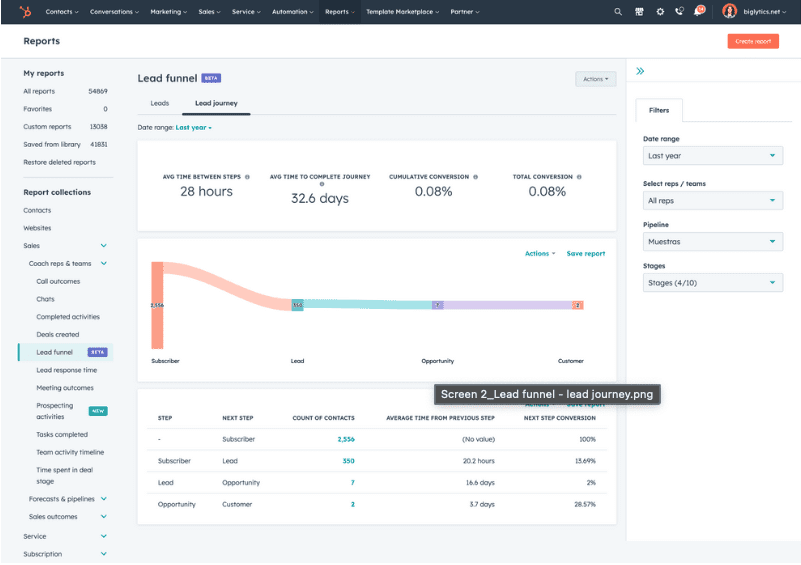
Within the Professional+ feature, you can also see the length of time spent a lead spends on each stage of the sales funnel.

Despite the sales funnel, not every lead goes from top to bottom straightforwardly. HubSpot’s deal funnel report takes this into consideration by reporting things like:
Those with Enterprise-level reporting can customize these analytics even further by using visualization tools. For example, you can set your filtering to look at funnel stages through a Sankey chart. (Sankey is a type of graphic that shows the flow of resources and emphasizes change from one stage to the next.)
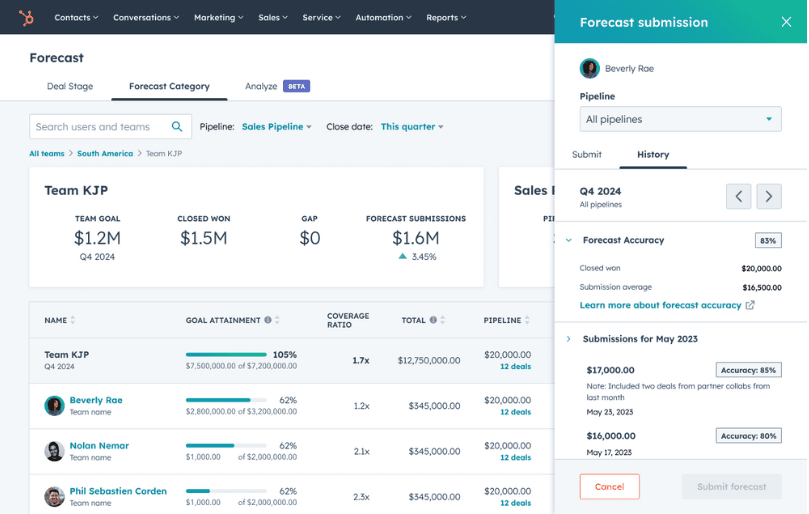
HubSpot’s Sales Hub offers integrated reporting and among the many useful tools to stay on track to achieve goals and gain insights, there’s an effective way to forecast.

Using the Professional+ view, it’s now possible to consider historical data from the sales team to gain a deeper level of how pipelines are trending across teams. The data looks at factors such as:
You can use this information back up future revenue predictions more accurately.
We think these changes are going to uplevel the way you and your sales team operate, from both a day-to-day perspective and long-term.
Analytics and reporting are essential so you can scale your business quickly. While one study revealed that 87% of companies are using marketing automation software, only 25% say they’re actually making extensive use of it. Don’t let your marketing automation go to waste.
The Automation Company is a team of HubSpot experts and can help you optimize your automation tools. We can also provide detailed guidance if you’d like to learn more about these changes within reporting and analytics.
Reach out to us today, we’d love to hear from you.