Data serves as the lifeblood of informed decision-making, providing organizations with the insights they need to stay competitive in today’s fast-paced business landscape. However, the mere presence of data isn’t enough; it’s essential to present it in a way that maximizes its utility and impact. In this post, we’ll embark on a journey through the realms of reporting and analytics, unraveling the intricacies between informational reports and analytical reports. By understanding these nuances, you’ll gain the tools to wield both types of reports effectively, weaving them together to craft a narrative that drives business growth.
The significance of this distinction cannot be overstated. Informational reports offer a panoramic view of past events, providing stakeholders with a snapshot of historical performance. On the other hand, analytical reports dive deeper into the data, extracting actionable insights that inform future strategies. By mastering the art of combining both types of reports, organizations can unlock the full potential of their data, transforming it into a powerful tool for decision-making and innovation.
Reporting vs. Analytics: Understanding the Divide
Reporting and analytics, while often used interchangeably, serve distinct purposes. Let’s break down the key differences:
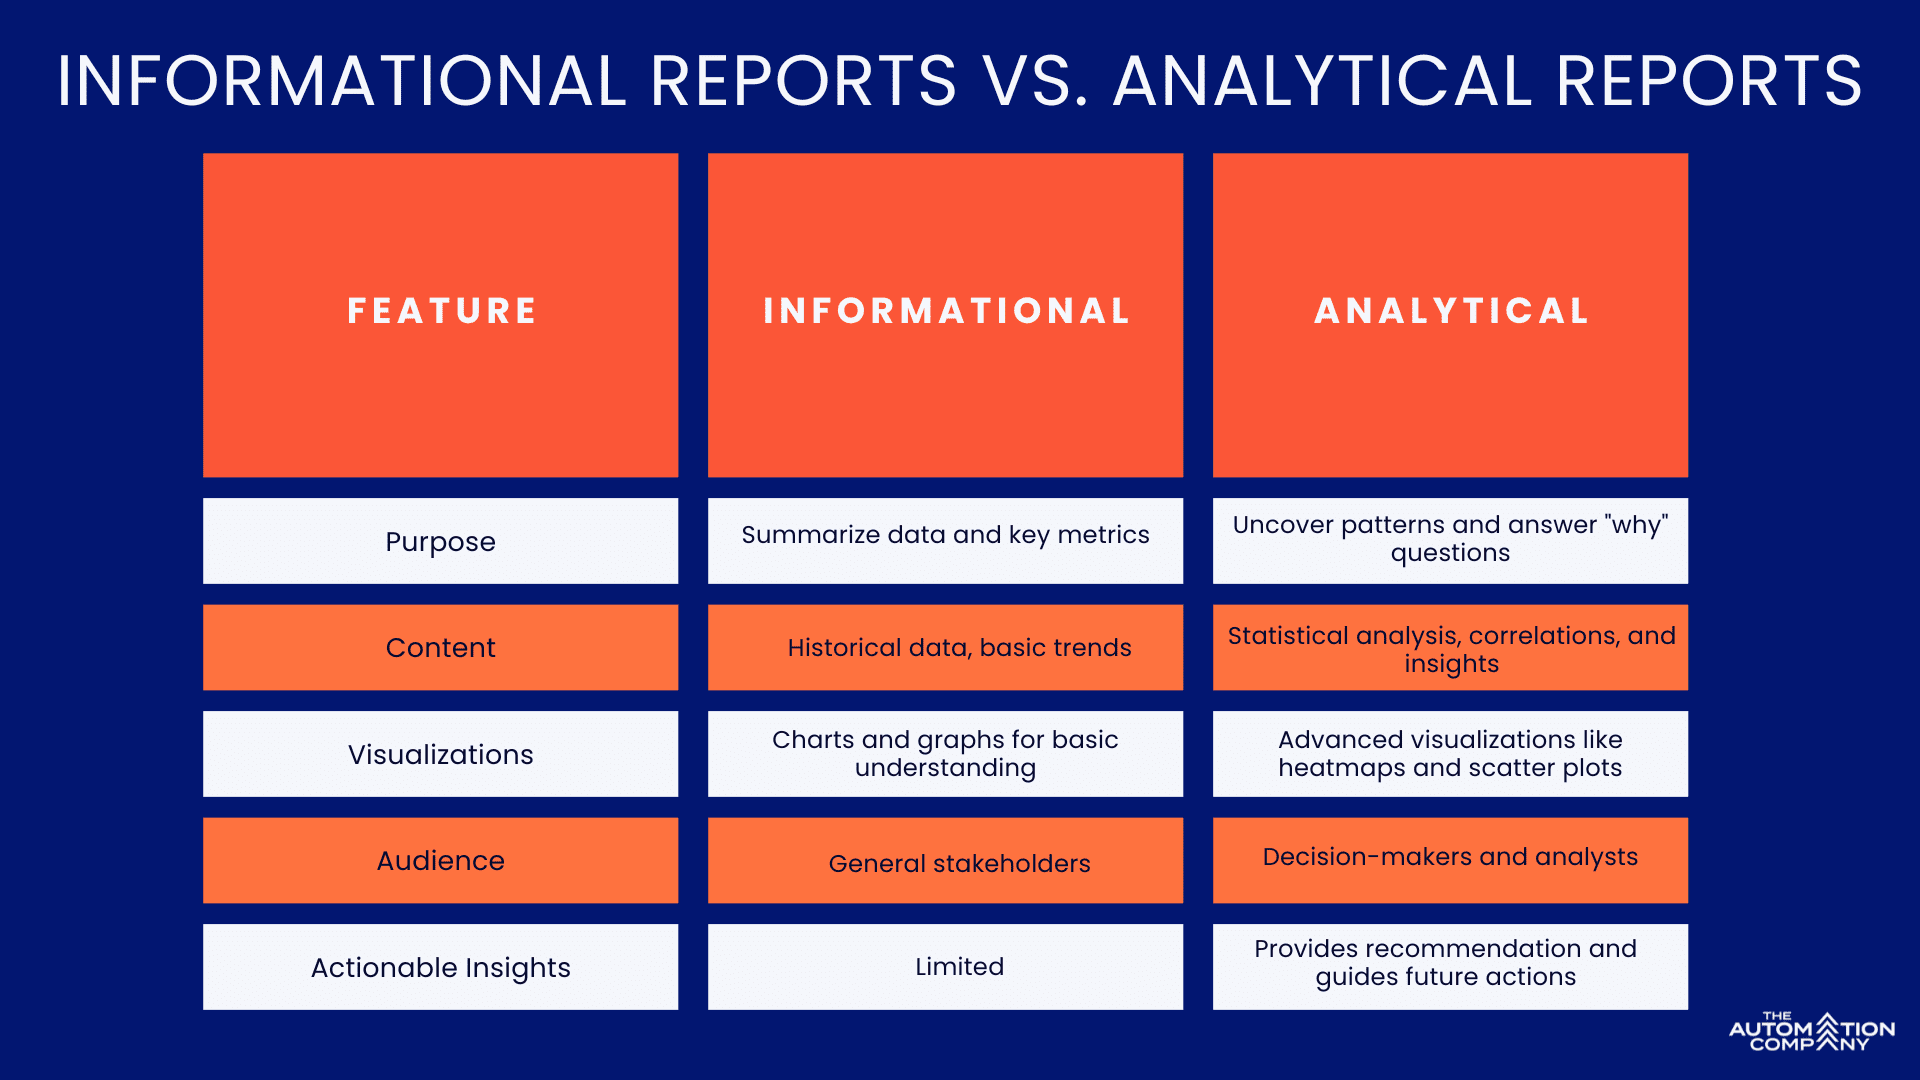
- Reporting: Reporting focuses on presenting data in a clear, organized format. Think of it as a historical snapshot, summarizing key metrics and trends. Informational reports are a prime example, providing a surface-level understanding of what happened. Common report formats include sales reports by region, financial statements for a specific quarter, and website traffic summaries for the past month. These reports are crucial for keeping stakeholders informed and aligned on current performance.
- Analytics: Analytics goes beyond reporting. It involves deep-diving into data to uncover patterns, identify trends, and answer “why” questions. Analytical reports take information from informational reports and delve deeper, providing insights to guide future strategies. Techniques like data mining, statistical analysis, and visualization are employed to uncover these insights. Analytical reports might explore customer buying behavior across different demographics, analyze website user journeys to identify conversion bottlenecks, or compare marketing campaign performance metrics to determine the most effective strategies.

Informational Reports vs. Analytical Reports: Decoding the Details
Here’s a breakdown of how informational reports and analytical reports differ across various aspects:
The Power of Combining Both: Building a Cohesive Data Narrative
Informational and analytical reports serve as crucial tools in your data storytelling arsenal, working together to paint a complete picture:
- Informational reports lay the foundation, providing context and a clear picture of what’s happening. These reports establish a baseline understanding for stakeholders and act as a springboard for further analysis.
- Analytical reports build upon this foundation, extracting hidden gems from the data to guide strategic decision-making. They answer the “why” questions and unlock actionable insights. By analyzing trends and patterns, analytical reports can help predict future outcomes and inform strategic changes.
Leveraging both types of reports unlocks the full potential of your data, transforming it from a collection of numbers into a compelling narrative that fuels business growth.
Advanced Data Storytelling Techniques:
To create impactful data stories that resonate with your audience, consider these additional tips:
- Focus on the audience: Tailor your reports to the specific needs and interests of your target audience. Use clear, concise language and avoid technical jargon if presenting to a non-technical audience.
- Start with a clear question: Clearly define the question you’re trying to answer with your data analysis. This will guide your data exploration and ensure your reports are focused and insightful.
- Keep it visually appealing: Utilize charts, graphs, and other visuals to make your data easy to understand and remember. Employ color, design elements, and different chart types strategically to highlight key findings and trends.
- Tell a story: Don’t just present data; weave it into a narrative that captures attention and inspires action. Use storytelling techniques like introductions, conclusions, and transitions to create a cohesive flow.
- Support your findings with evidence: Back up your conclusions with data points and examples. This builds trust with your audience and strengthens the impact of your recommendations.
- Embrace interactivity: Consider incorporating interactive elements into your reports, such as clickable charts or drill-down capabilities. This allows users to explore the data further based on their specific interests.
Beyond the Basics: Advanced Analytics Techniques
As you progress on your data storytelling journey, consider incorporating more advanced analytics techniques into your workflow:
- Data mining: Uncover hidden patterns and relationships within large datasets that traditional analysis might miss.
- Predictive modeling: Utilize statistical models to forecast future trends and outcomes based on historical data.
- Machine learning: Leverage algorithms to automate data analysis tasks and
Ready to Master the Art of Data Storytelling?
At The Automation Company, our dedication to empowering businesses through data visualization and analytics is unwavering. We understand that in today’s digital age, data is not just an asset; it’s the cornerstone of success. With years of experience in the field, we’ve witnessed firsthand the transformative power of data-driven insights. Whether you’re a small startup or a multinational corporation, our tailored solutions are designed to meet your unique needs and challenges. From streamlining operations to identifying new revenue streams, our data visualization and analytics expertise can help you unlock hidden opportunities and drive business excellence.
But our commitment doesn’t end with technology. We believe in the power of collaboration and partnership, working closely with our clients to understand their goals and objectives. By fostering a culture of innovation and continuous improvement, we empower organizations to stay ahead of the curve and adapt to evolving market dynamics. Our dedicated team is here to support you every step of the way, from initial consultation to implementation and beyond. Together, we’ll leverage the power of data to propel your business to new heights of success.
